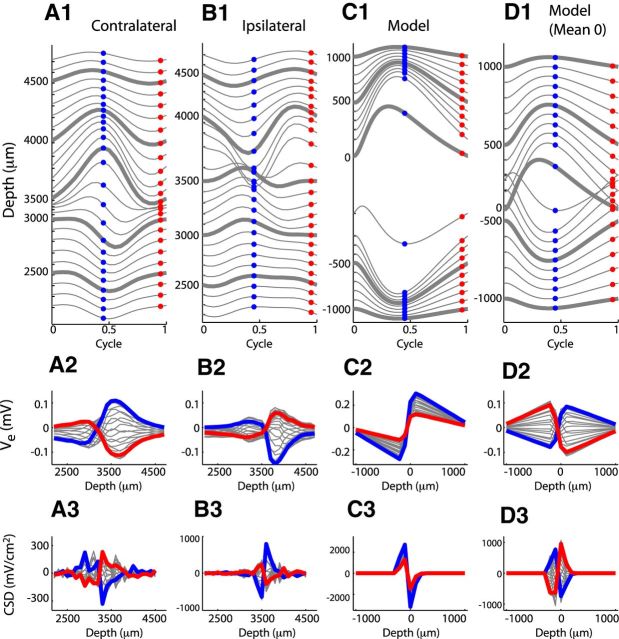
Figure 5.
Comparison of neurophonic response to 1200 Hz monaural pure tones (contralateral and ipsilateral) and monolateral input trains (model). Data are from the same recording sessions as those in Figure 3. Top row, Cycle-averaged neurophonic responses plotted over one cycle at each recording depth. The vertical position of each trace is determined by its mean value and by a 0.04 mV offset between adjacent traces for clarity of presentation. Bottom row, Spatial profile of cycle-averaged neurophonic responses. The blue and red dots in the top panels form the blue and red spatial profiles in the bottom panels. A, In vivo neurophonic response to contralateral tone. B, In vivo neurophonic response to ipsilateral tone. C, Simulated neurophonic response for excitation on dendrite at negative depth. One cycle of the ongoing response (after transient effects caused by the initial resting state of the neuron model have disappeared). D, Same as in C with mean value removed at each spatial location to mimic the effect of the 10 Hz high pass filter imposed by the data acquisition system in experiments.

