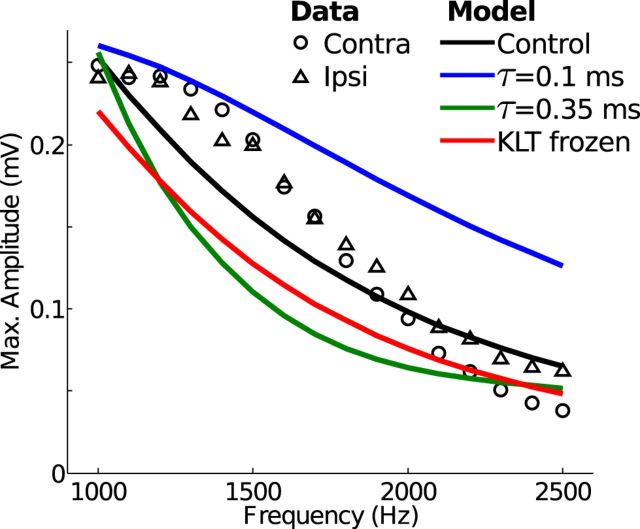
Figure 8.
Maximum amplitude of oscillations in the neurophonic response to monaural pure tones (data) and monolateral trains of excitation (model). Maximum amplitude of oscillations is calculated as the maximum (over all recording depths) of the peak-to-trough change in voltage in one cycle of the cycle-averaged neurophonic response. In vivo neurophonic responses to contralateral (circles) and ipsilateral (triangles) tones compared with simulated neurophonic responses. In the “control” case of the model (black line), synaptic inputs have τsyn = 0.2 ms and peak conductance Gsyn = 10 mS/cm2. Fast synaptic kinetics (blue) have τsyn = 0.1 ms. Slow synaptic kinetics (green) have τsyn = 0.35 ms, and peak conductance is tripled to maintain the amplitude of the response at 1 kHz. Red line indicates simulated neurophonic response when the low-threshold K+ conductance is “frozen” at its value for resting membrane potential.

