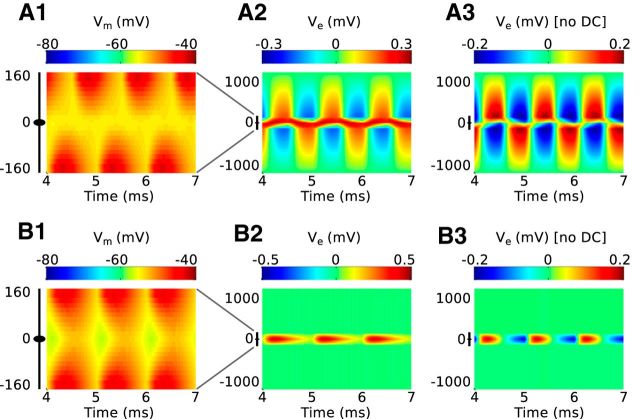
Figure 9.
Response of the model to 1 kHz bilateral excitatory inputs. Row A, Excitatory inputs arrive out of phase on the two dendrites (0.5 ms time difference). Row B, Excitatory inputs arrive in phase on the two dendrites (coincident inputs). A1, B1, Spatiotemporal profile of membrane potential. The ordinate represents the mediolateral or dendritic distance in micrometers, with 0 representing the soma. The abscissa is the time axis; it begins at 4 ms to show only the ongoing response. The black icon at left represents the dimensions of the neuron model. A2, B2, Spatiotemporal profile of the simulated neurophonic; note the change in scale on the ordinate from left column. A3, B3, Spatiotemporal profile of the simulated neurophonic with mean value removed from every spatial location. This mimics the 10 Hz high pass filter imposed by data acquisition system in experiments of Mc Laughlin et al. (2010).

