Figure 1.
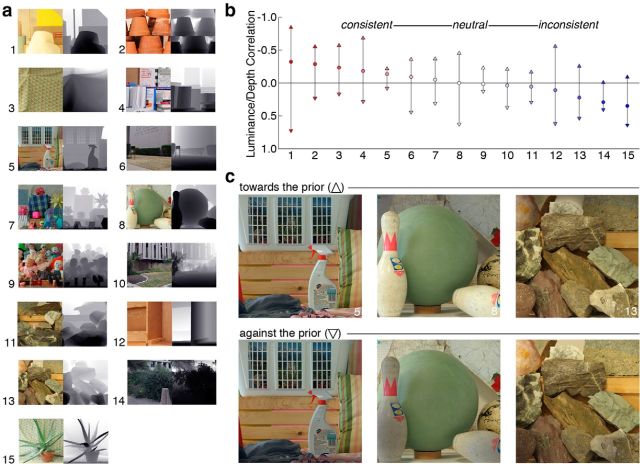
Stimuli for the perceptual experiment. a, Photographs with registered ground-truth depth information. Grayscale depth maps are shown to the left, with darker values indicating near depths. b, Correlations between luminance and depth in the experimental stimuli. Each circle represents one of the 15 scenes used in the perceptual experiment and shown in a. The circle symbols represent the correlation (Pearson's r) between luminance and depth in the original scenes. Markers are colored to indicate the relative strength of the correlation: red represents negative and consistent with overall scene statistics; blue represents positive and inconsistent with overall scene statistics; white represents neutral, or near zero correlation. We performed an image manipulation to create two new versions of each scene. Upward and downward triangles represent the new correlations after manipulating the images toward the prior or against the prior, respectively. The y-axis is reversed so that negative correlations (consistent with prior from scene statistics) point upward. c, Example photographs after manipulation. One new version was shifted toward the prior; these all have a negative luminance/depth correlation (upward triangle symbols in b). The other new version was shifted against the prior; these all have a positive luminance/depth correlation (downward triangle symbols in b).

