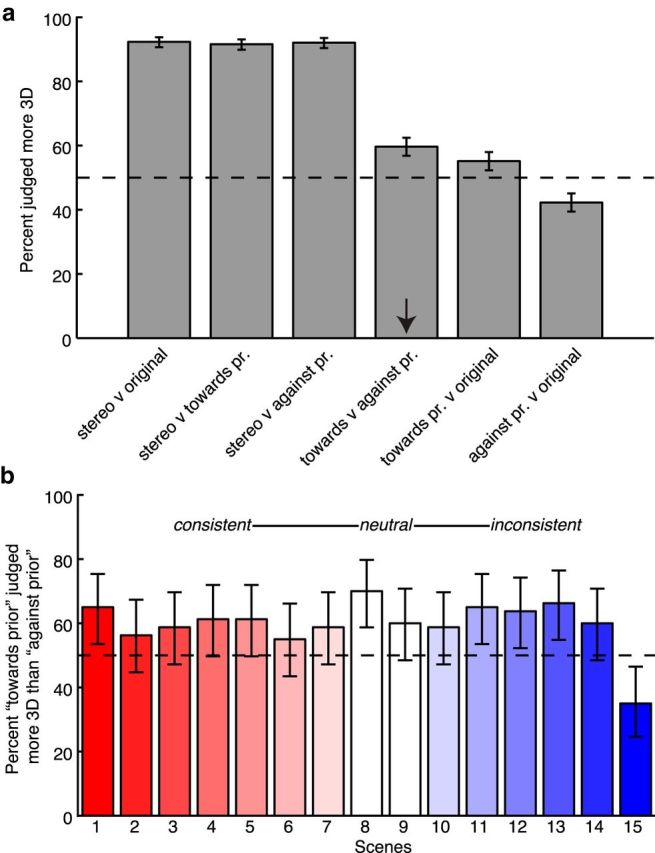
Figure 3.

Perceptual experiment results. a, Results for each condition collapsed across all scenes. Bar heights indicate the percentage of all trials in which the first-listed image version was judged as more 3D than the second-listed image version. pr, Prior. Error bars indicate 95% confidence intervals. b, Results for the “toward the prior” versus “against the prior” comparison (arrow in a) separately for each scene. Bar coloring is the same as Figure 1b.
