Figure 2.

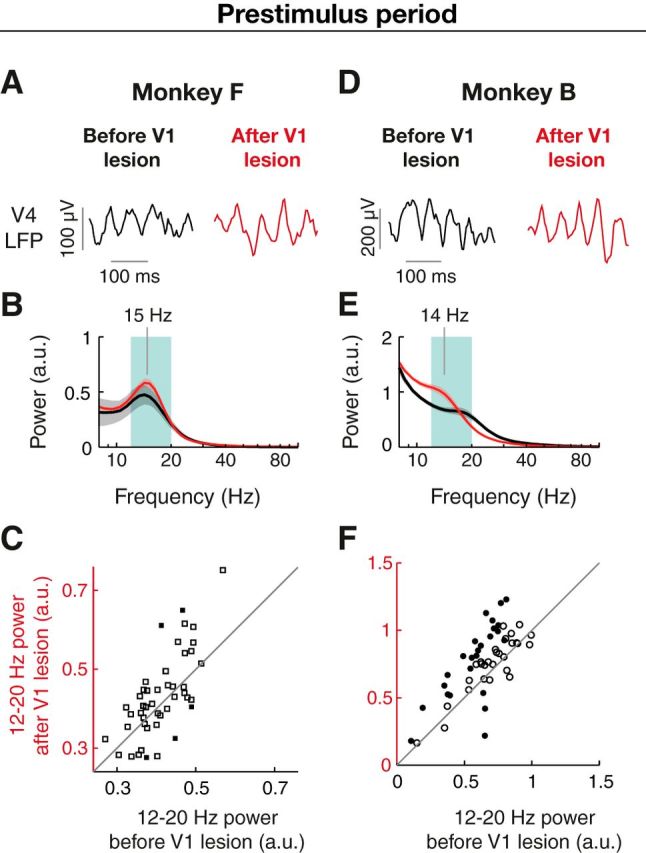
Beta oscillations during active fixation in area V4 are preserved after selective removal of V1. A, Example prestimulus beta oscillations of the unfiltered V4 LFP before (black, left) and after V1 lesion (red, right). B, Absolute power spectrum of the prestimulus period before (black, n = 5 sessions, each comprising 1000–1300 trials) and after (red, n = 13 sessions) from an example V4 electrode in Monkey F, averaged across trials and sessions. Gray and red shadings represent SEM across sessions before and after lesion, respectively. C, Distribution of power in the beta frequency range (12–20 Hz, green shading in B) during prestimulus period before and after V1 lesion. Each dot represents the beta-band power at a recording site averaged across sessions. Filled and open symbols represent recording sites with significant or nonsignificant changes in power (p < 0.05, independent samples t test), respectively. Gray line indicates identical prelesion and postlesion power. D–F, Example beta oscillations (D), wavelet spectrum (E), and beta power distribution (F) for Monkey B before (n = 7 sessions) and after (n = 5 sessions) V1 lesion.
