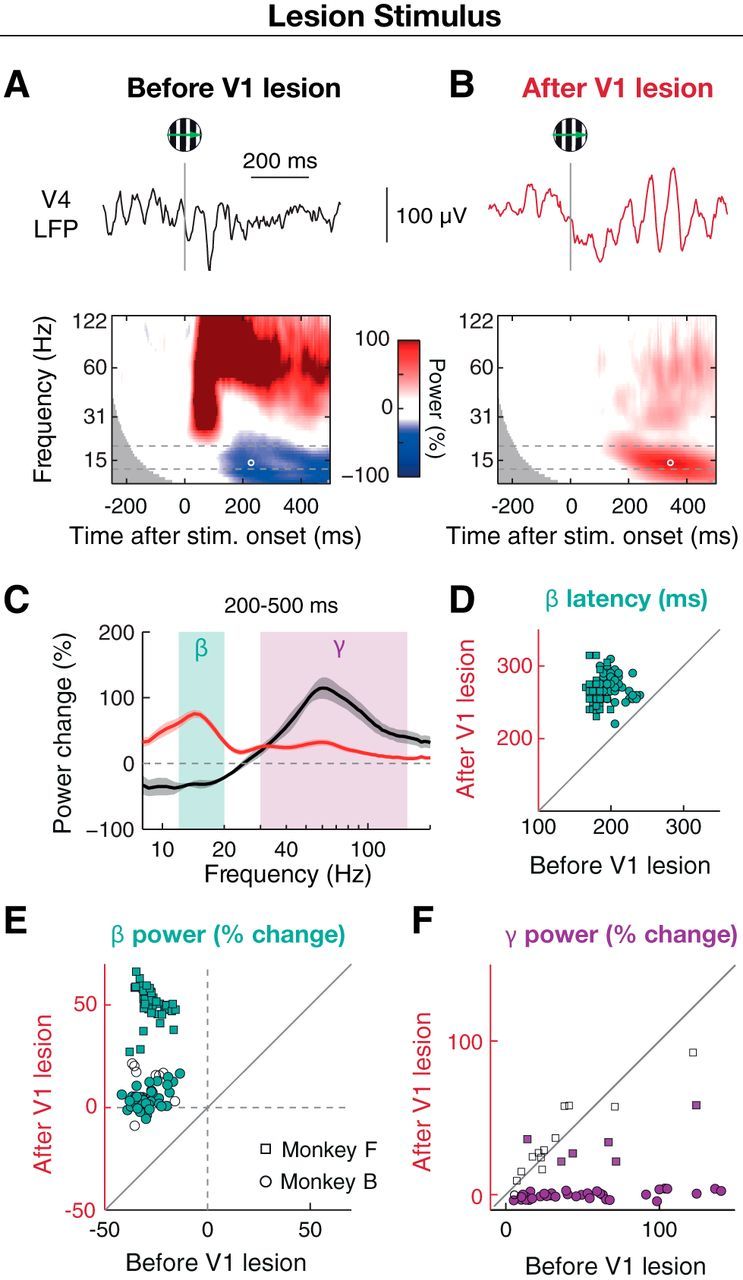
Figure 3.

Visual stimulation in lesion-affected visual space induces strong beta (12–20 Hz) oscillations in V4 instead of decreasing beta power. A, Example LFP responses to a moving grating stimulus (high contrast, varying spatial frequency, and drift direction) in the lesion-affected part of visual space from a recording site in Monkey F before the V1 lesion. Upper row, Single trial LFP trace. Gray line indicates stimulus onset. Lower row, Session-averaged (n = 5), baseline-normalized wavelet power spectra from an example electrode in Monkey F (data as in Fig. 2). White circle represents peak latency within the beta frequency band (dashed lines). B, Same as A for data from after the V1 lesion (n = 11 sessions). Note the unusual stimulus-induced beta oscillations visible in both single trials and average. C, Baseline-normalized power spectra from example recording site in A averaged across 200–500 ms period and sessions for lesion stimulus, before (black) and after (red) V1 lesion. Shadings surrounding curves represent SEM across sessions. D, Distribution of beta power peak latency before and after V1 lesion. E, Distribution of baseline-normalized power in beta band before and after V1 lesion for lesion stimulus. Each dot represents a power value from one recording site averaged across the beta band, 200–500 ms period, and sessions. F, Same as E for the gamma frequency band (30–150 Hz). E, F, Open and filled symbols represent recording sites with nonsignificant and significant changes in power on the individual electrode level (p < 0.05, independent samples t test), respectively.
