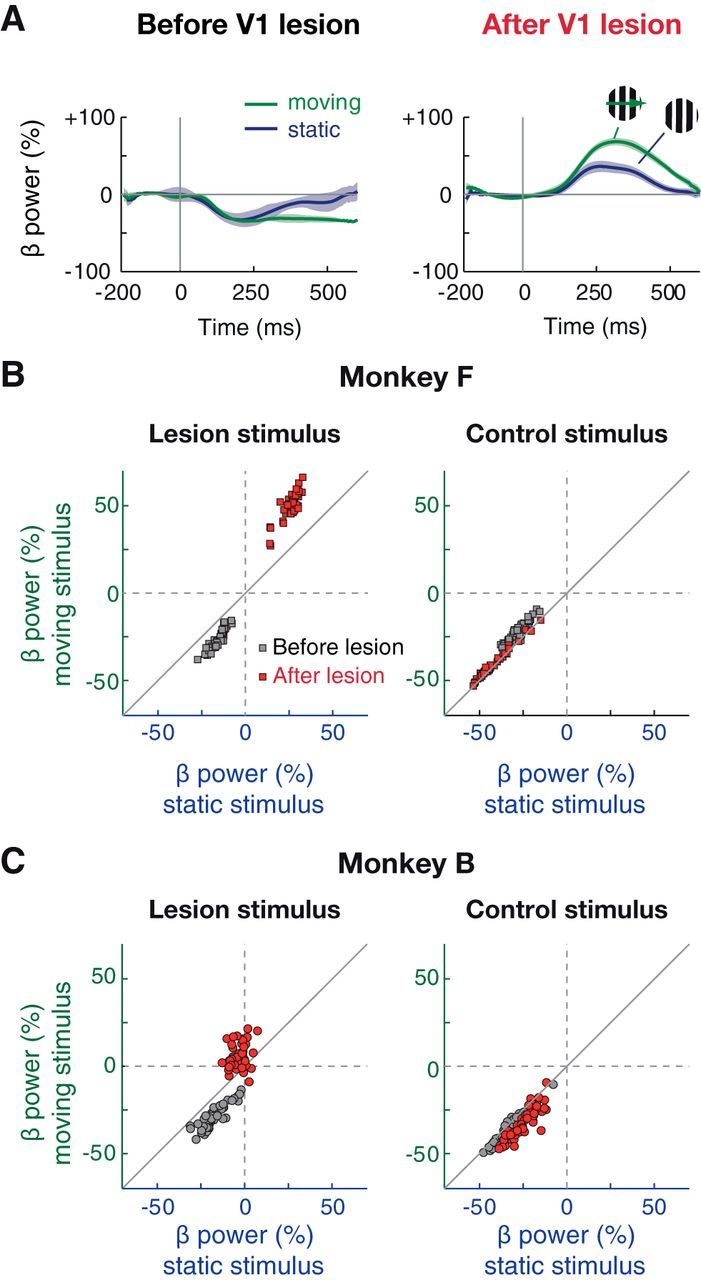
Figure 5.

V1-independent beta oscillations are sensitive to motion. A, Time course of baseline-normalized power in beta (12–20 Hz) band from example recording site and sessions in Monkey F for moving (green) and static (blue) grating stimuli (high contrast, varying drift direction/orientation, and spatial frequency for both) at the lesion stimulus location. Shading represents SEM. B, Distribution of beta power values (200–500 ms) for moving versus static stimuli for lesion (left) and control stimulus (right) from Monkey F (data as in Figs. 3 and 4). C, Same as B for Monkey B.
