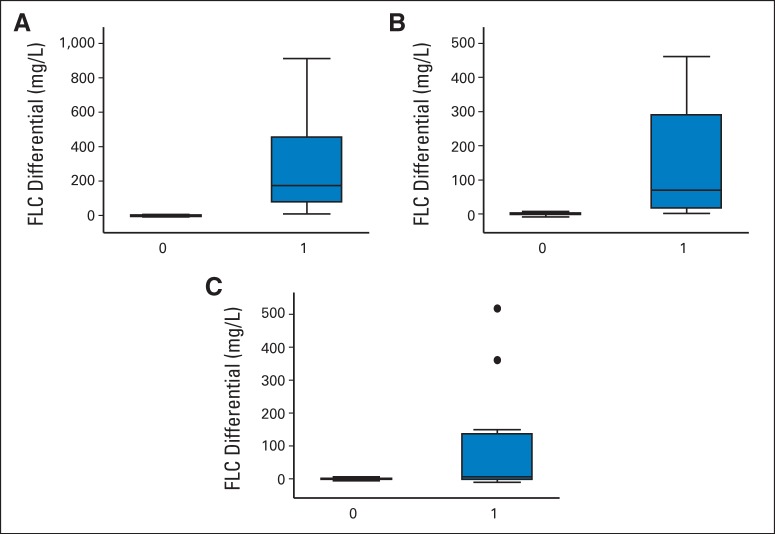
Fig A1.
Box plots representing free light chain (FLC) differential levels in cases and controls in the years before diagnosis of immunoglobulin light chain (controls = 0; cases = 1). FLC differential by case (A) < 4 years, (B) 4 to 11 years, and (C) > 11 years before diagnosis. The horizontal bar represents the median, vertical bars represent the highest and lowest values that are not outliers, and the dots are outliers (defined as outside 1.5 times the interquartile range). The lower and upper end of each box represents the first and third quartile, respectively. Interquartile range is defined as the third quartile subtracted from the first quartile.

