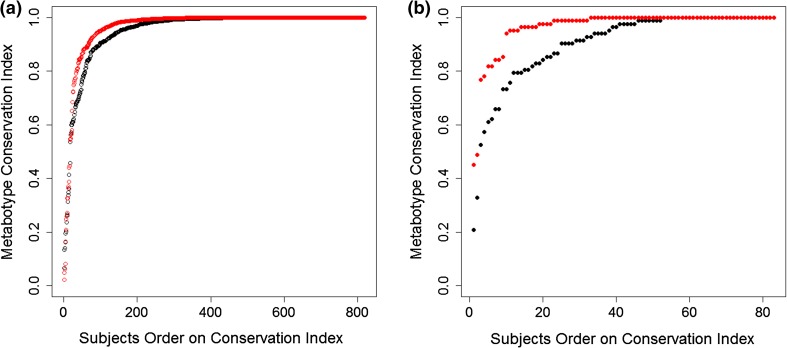
Fig. 2.
Metabotype conservation index. The conservation index of the metabotype of a study participant is defined as the relative rank of the longitudinal intra correlation of the metabolic profile of that individual compared to the longitudinal inter-correlations with the profiles of all other study participants. The conservation index is plotted in black, while using weighting with metabolite correlations is shown in red; In KORA (a), 40 % of the subjects have a metabotype conservation index of one, which increases to 52 % when metabolite-weighting is used. In the TwinsUK replication (b), the corresponding conservation index values are 37 % (black curve) and 61 % (red curve), for unweighted and weighted conservation index respectively

