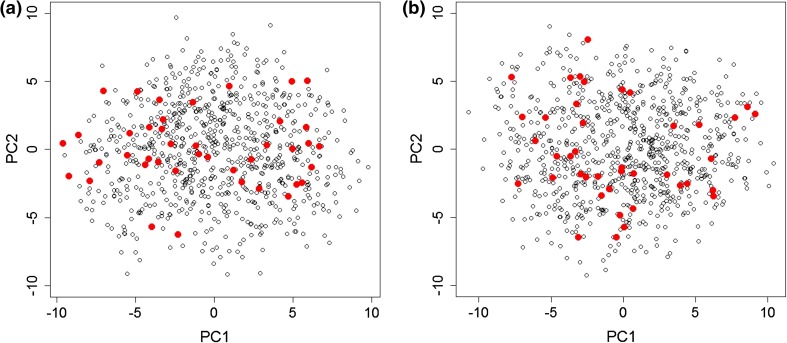
Fig. 3.
PCA of KORA S4 (a) and F4 (b) shows the 5 % least conserved individual metabotypes (red dots) after weighting metabotype conservation index using metabolite correlations. The least conserved metabotypes do not show a different behavior than the rest of the data, thus using both time points S4 and F4 with the conservation index is the method for identifying those least conserved ones

