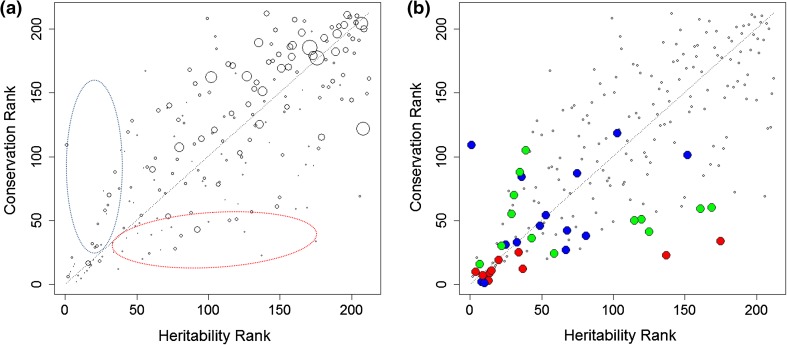
Fig. 4.
Heritability of metabolic traits compared to their conservation between two time points. a Marker size is proportional to the variance of technical replicates compared to their mean (RSD), and showing more heritable than conserved region in the blue ellipse area, and more conserved than heritable region in the red ellipse area. b The 15 most strongly associated metabolites with gender (red), age (blue), and BMI (green) (see Supplemental Table 2 for metabolite names)

