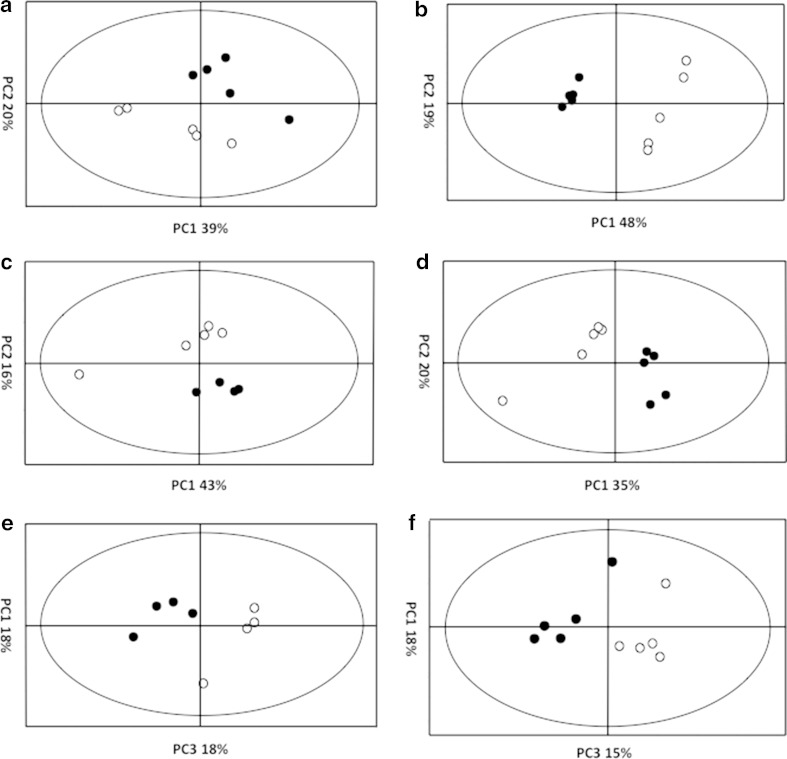
Fig. 1.
Principal component analysis (PCA) of C. jejuni NCTC 11168 and amino acid catabolism mutant strains. Metabolite levels in multiple replicates of C. jejuni NCTC 11168 and aspB strains were analysed by ESI-TOF MS in positive and negative ionisation mode and processed so that centroid m/z peaks were converted to text file peak lists and placed into 0.2 Da bins. Principal component analysis was performed on these bin lists. PCA plot a and b show analysis of positive and negative ionization datasets respectively for C. jejuni NCTC 11168 (filled circles) and aspA (open circles). PCA plot (c) and (d) show analysis of positive and negative ionization datasets respectively for C. jejuni NCTC 11168 (filled circles) and aspB (open circles). PCA plot (e) and (f) show analysis of positive and negative ionization datasets respectively for C. jejuni NCTC 11168 (filled circles) and sdaA (open circles). In all instances mutant strains were observed to group separately from their isogenic parent strain

