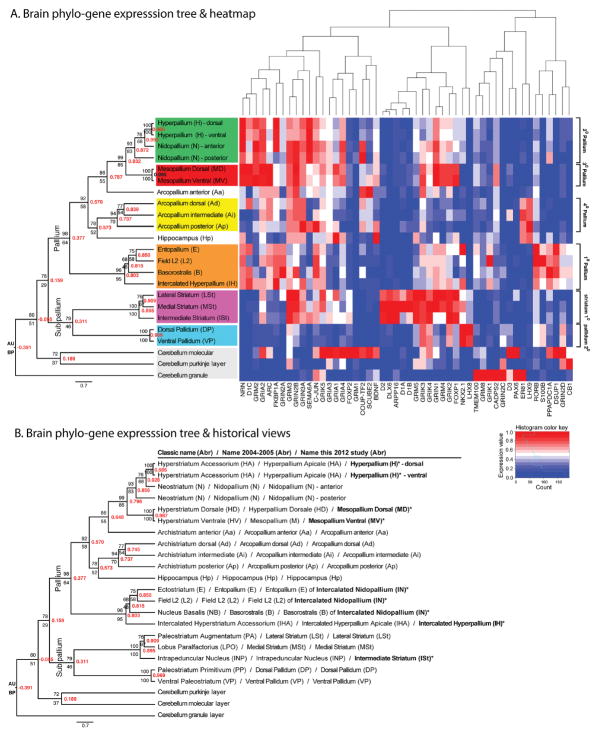
Figure 3.
Brain phylo-gene expression tree. A: Tree (left) and gene expression heatmap (right) showing molecular relationships of 23 brain regions of the zebra finch based on 50 genes. The six major telencephalic subdivisions revealed by the tree are color-coded. The tree was generated with Distance-Correlation (red values inside nodes) on normalized gene expression data, followed by Biedl’s ordering of leaves according to similarity of gene expression vectors. Also shown are the Approximately Unbiased (AU) probability values above the nodes and Bootstrap Probabilities (BP) below the nodes for 1,000 replicates using Pvclust. Far right is the more global numbered pallial and sub-pallial terminologies based on this tree and known connectivity. The gene expression heatmap shows relative expression levels for each gene scaled between 0–1 (red, higher than the average for that region relative to other regions; blue, lower than the average). Above the heatmap is the tree relationship of the genes based on brain expression. B: The same tree as in (A), but with all three nomenclatures compared: the classical, 2004–2005 revisions, and this study. Bold text are newly defined terms in this study.

