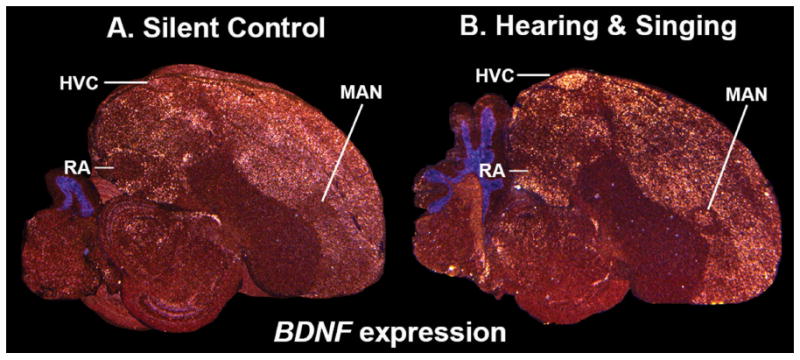
Figure 32.

BDNF and singing. A: Lateral section from a quiet control animal showing basal BDNF expression in pallial regions, and even lower expression in song nuclei. B: Lateral section of a singing animal, showing the highest levels of singing-driven increased gene expression in pallial song nuclei HVC and LMAN, and a low level increase in RA. Images are from emulsion-dipped slides of sections adjacent to those shown in Fig. 28. Scale bar = 1 mm.
