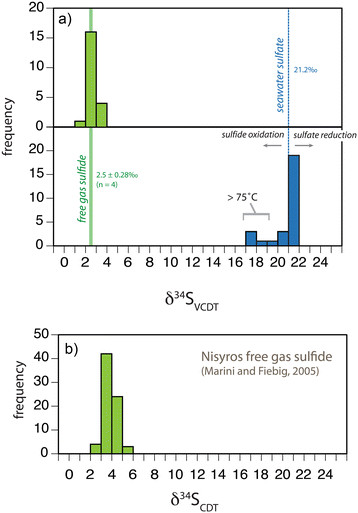
Figure 9.

Sulfur isotope compositions of pore fluids and free gas samples. (a) Frequency distribution of δ34S values for sulfide (green) and sulfate (blue) collected from Palaeochori Bay, Milos (this study). The vertical solid line is the average of free gas sulfide in Palaeochori Bay (δ34S = 2.5‰) and the width of the line is the standard deviation of all measurements (±0.28‰, n = 4). The dashed vertical line represents seawater sulfate (δ34S = 21.2‰). (b) Frequency distribution of free gas sulfide δ34S at Nisyros Island [30]. Note, the δ34S values for this study (a) were normalized to VCDT and the literature values (b) were referenced to CDT.
