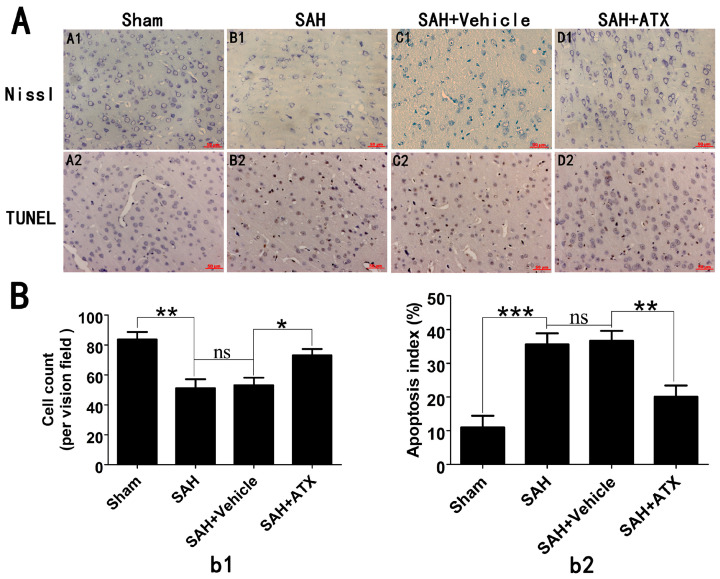
Figure 4.
(A) Representative photomicrographs of Nissl (A1–D1) and TUNEL (A2–D2) staining in the cerebral cortex at 24 h after SAH and (B) quantitative analysis of neuronal survival (b1) and the apoptotic index (b2). As shown in the Nissl staining, in the sham group, the neuronal cell outline was clear and the structure compact, with abundant cytoplasm and Nissl bodies. However, evident neuronal loss and neuronal degeneration were observed in the SAH group and SAH + vehicle groups. Treatment with ATX significantly increased the proportion of surviving neurons. The TUNEL staining showed that the rats in the sham group display rare apoptotic cells in the cortex, while obvious TUNEL-positive cells could be observed in the SAH group and SAH + vehicle groups. In contrast, the proportion of apoptotic cell death decreased significantly in the SAH + ATX group. Values are represented as the mean ± SEM. *** p < 0.001, ** p < 0.01, * p < 0.05, ns p > 0.05.

