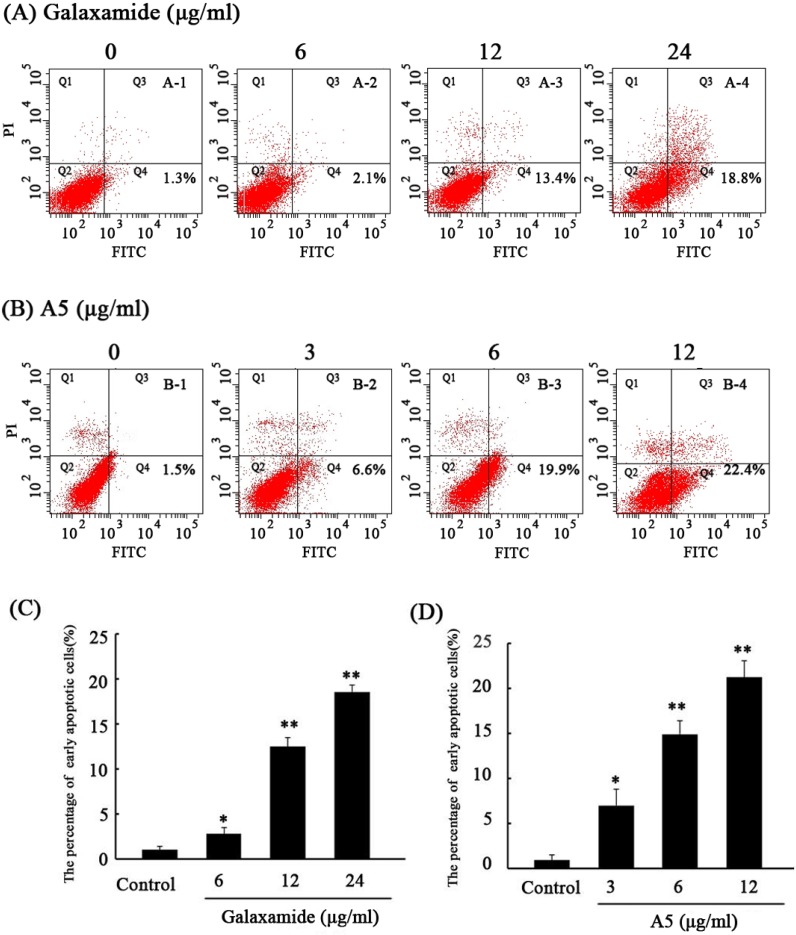
Figure 3.
Galaxamide and A5 affect the apoptosis of HepG2. HepG2 cells were treated with galaxamide or A5 at different concentrations for 72 h. The control and treated HepG2 cells were assessed using Annexin V-fluorescein isothiocyanate (FITC) and propidium iodide (PI) dual parameter flow cytometry. A dual parameter dot plot of FITC-fluorescence (x-axis) vs. PI-fluorescence (y-axis) shows a logarithmic intensity. A dual parameter dot plot of FITC-fluorescence (x-axis) vs. PI-fluorescence (y-axis) shows a logarithmic intensity. Quadrants: lower left, the live cells; lower right, the early apoptotic cells; upper left, the necrotic cells; and upper right, late apoptotic cells. (A,B) Representative Annexin V/PI double staining in the galaxamide (A) or A5 treatment group (B); and (C,D) a comparison of the percentages of early apoptosis in the galaxamide (C) or A5 treatment group (D). * p < 0.05 or ** p < 0.01 vs. the control groups.

