Figure 2.

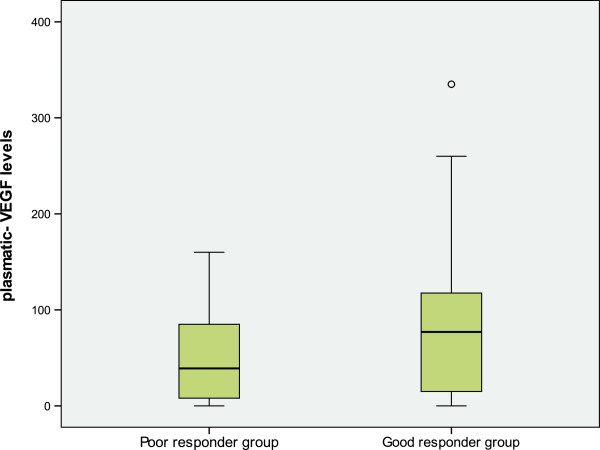
A box-plot diagram of plasma-VEGF levels stratified by the treatment response groups. The mean plasma-VEGF levels was higher in GR (86,61 pg/ml) compared to PR (47,12 pg/ml) (p=0.086).

A box-plot diagram of plasma-VEGF levels stratified by the treatment response groups. The mean plasma-VEGF levels was higher in GR (86,61 pg/ml) compared to PR (47,12 pg/ml) (p=0.086).