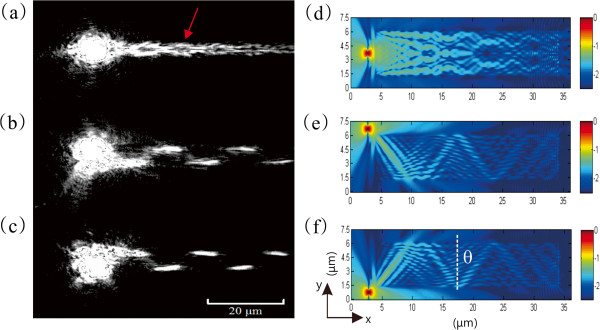
Figure 3.

A multimode waveguide excited by NFES. (a) Leakage radiation image when the fiber tip was at the center of the waveguide. The red arrow shows the location of intensity was spitted into 50:50. (b, c) Leakage radiation images when the fiber tip was located at two different corners of the waveguide. (d to f) The calculated optical field distributions (Ez) for near-field excitation at different positions, (d) at the center of waveguide, (e, f) and at two different corners.
