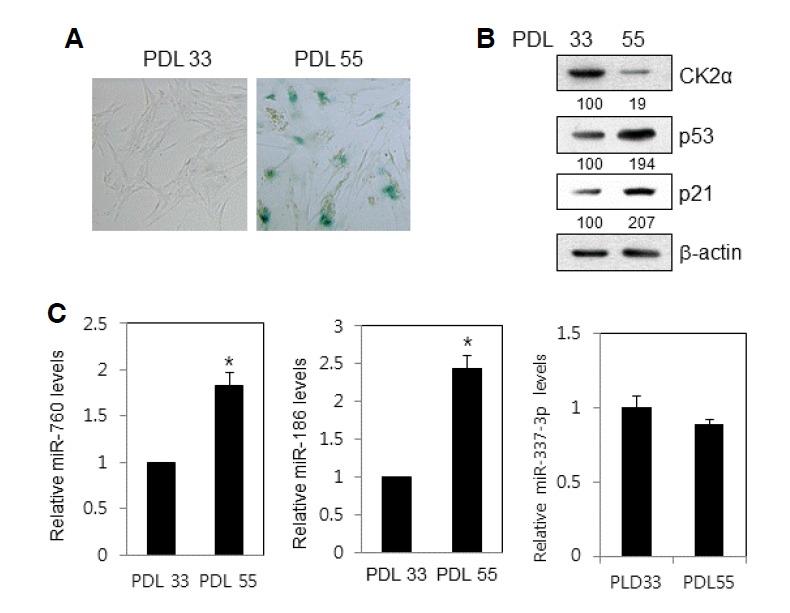
Fig. 1.

Upregulation of miR-760 and miR-186 expression in replicatively senescent IMR-90 cells. (A) After fixation in 2% formaldehyde/0.2% glutaraldehyde in PBS, IMR-90 cells of PDL 33 and PDL 55 were stained with 1 mg/ml of 5-bromo-4-chloro-3-indolyl-β-d-galactoside. Representative images were obtained at 20× magnification. (B) Cell lysates were electrophoresed on a 12% (w/v) SDS-polyacrylamide gel and visualized by Western blotting with appropriate antibodies. Quantification of each band was carried out by a densitometer analysis. The β-actin was used as a control. (C) Total RNA was isolated from IMR-90 cells of PDL 33 and PDL 55 and subjected to analysis by qPCR analysis to determine the relative levels of miR-760, miR-186, miR-337-3p, and miR-216b, using RNU48 for normalization. Data represent standard error of the mean from three independent experiments. Data are shown as the means ± SEM. *P < 0.05.
