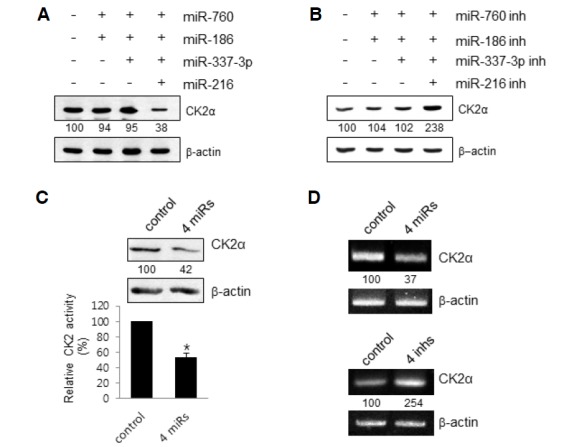
Fig. 2.

Effect of miR-760, miR-186, miR-337-3p and miR-216b on CK2α expression in proliferating IMR-90 cells. (A) IMR-90 cells (PDL 33) were transfected with control miRNA or different combinations of mimics the four miRNAs. After 2 days, effects of these mimics on the protein level of CK2α were determined by Western blot analysis. Quantification of each band was carried out by a densitometer analysis. The β-actin was used as a control. (B) IMR-90 cells (PDL 33) were transfected with different combinations of antisense inhibitors (inh) the four miRNAs. After 2 days, effects of different combinations of these mimics on the protein level of CK2α were determined by Western blot analysis. (C) IMR-90 cells (PDL 33) were transfected with control miRNA or the four mimics (4 miRs) for 2 days. Cell lysates were utilized in kinase assays using specific CK2 substrate peptides. 32P incorporation into the substrate peptide was measured by scintillation counting. Data are shown as the means ± SEM. *P < 0.05. (D) IMR-90 cells (PDL 33) were transfected with the four mimics (upper panel) or four inhibitors (bottom panel) for two days. Total RNA was extracted from cells and reverse-transcribed using CK2α-specific primers and reverse transcriptase. Primers for β-actin RNA were used as a control. PCR products were resolved on a 1.5% (w/v) agarose gel.
