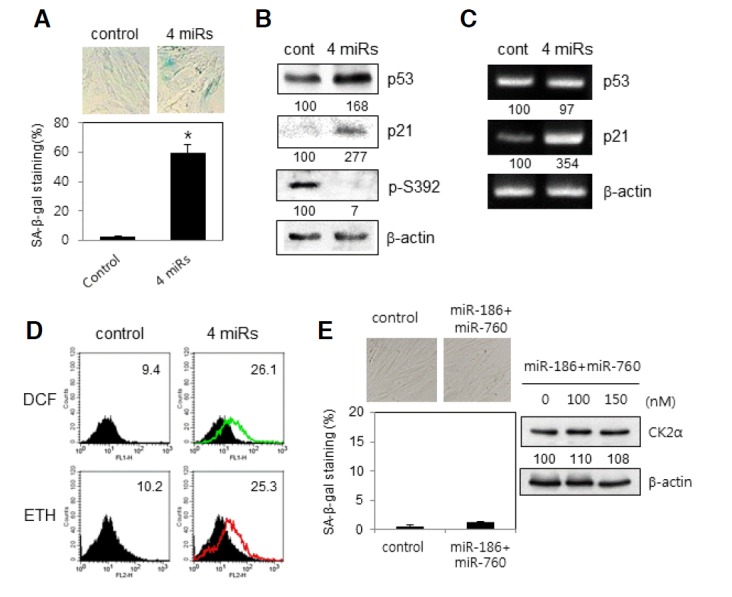
Fig. 4.

Induction of premature senescence by miR-760, miR-186, miR-337-3p and miR-216b in proliferating IMR-90 cells. IMR-90 cells (PDL 33) were transfected with the four mimics (A–D) or two mimics of miR-760 and miR-186 (E) for 2 days. (A) Cells were stained with 5-bromo-4-chloro-3-indolyl-β-d-galactoside, and representative images were obtained at 20× magnification (upper panel). The percentage of positively stained cells was measured (bottom panel). Data are shown as the means ± SEM. *P < 0.05. (B) Cell lysates were electrophoresed on a 12% (w/v) SDS-polyacrylamide gel and visualized by Western blotting with appropriate antibodies. Quantification of each band was carried out by a densitometer analysis. (C) Total RNA was extracted from cells and reverse transcribed using p21 and p53-specific primers. PCR products were resolved on a 1.5% (w/v) agarose gel. (D) Cells were incubated with CM-H2DCFDA or DHE as described in “Materials and Methods.” Fluorescence intensity was determined by flow cytometry analysis. The mean fluorescence intensity is shown in the upper right corner of the histograms. (E) Cells were stained with 5-bromo-4-chloro-3-indolyl-β-d-galactoside, and representative images were obtained at 20× magnification (left upper panel). The percentage of positively stained cells was measured (left bottom panel). Cell lysates were electrophoresed on a SDS-polyacrylamide gel and visualized by Western blotting (right panel).
