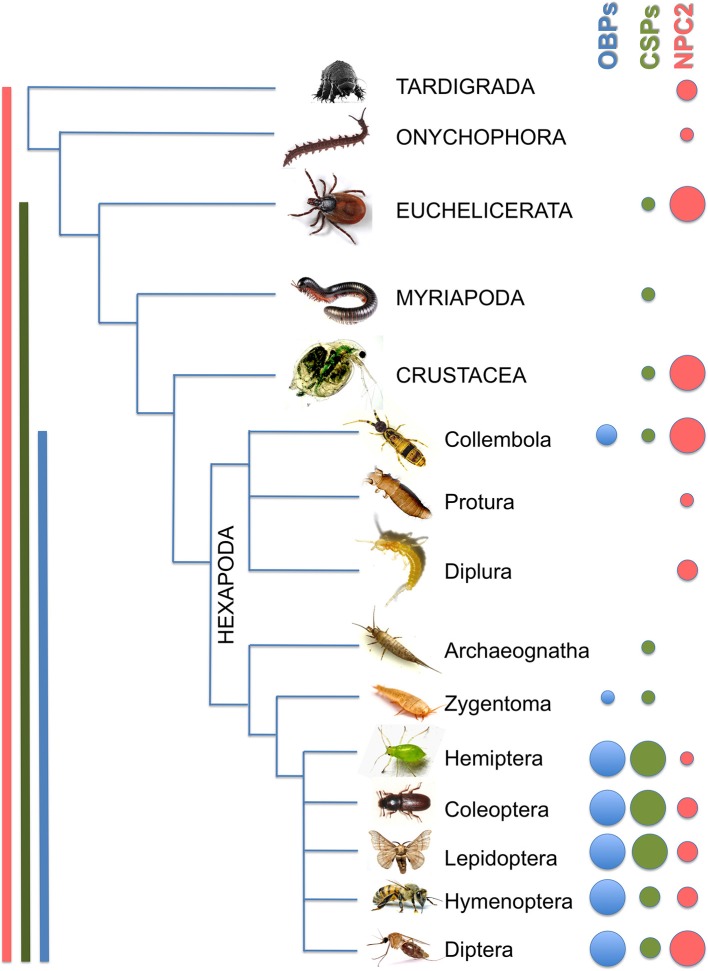
Figure 8.
Overview of OBPs, CSPs and NPC2 genes in arthropods and sister groups. Taxa are reported in capital letters, Orders in sentence case. Sizes of the dots indicate the maximum number of genes found in each species of the same group (small: 1–2; medium: 3–10; large: >10). Detailed information is reported in Table 1.

