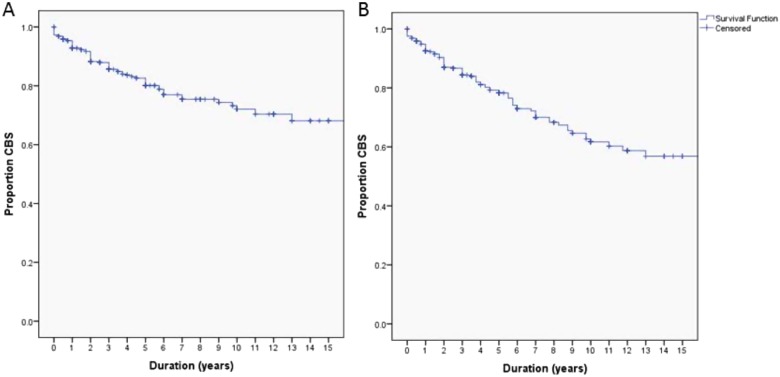
Figure 2.
Kaplan–Meier plots of Charles Bonnet Syndrome (CBS) duration. (A) The proportion of the sample with CBS each year after onset based on self-report of CBS resolution. The vertical dashes indicate censored observations. (B) The proportion of the sample with CBS each year after onset with CBS resolution defined as an absence of hallucinations in the 3 months prior to the questionnaire.

