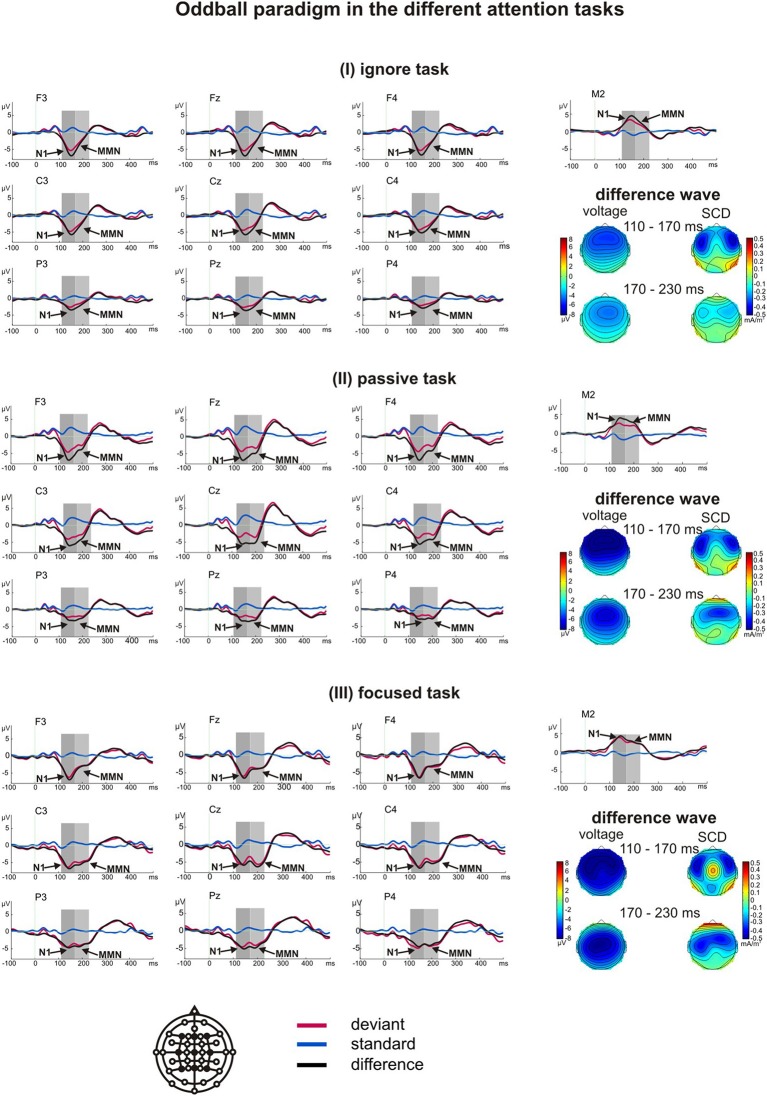
Figure 1.
Grand average ERPs of the oddball paradigm obtained in the ignore task (I), passive task (II) and focused task (III). The arrows indicate the critical significant components N1 and MMN and the gray boxes represent the time window used for analysis. The voltage and scalp current density (SCD) maps of the difference waves for both time windows reveal the respective scalp distributions and the possible generators for the components.

