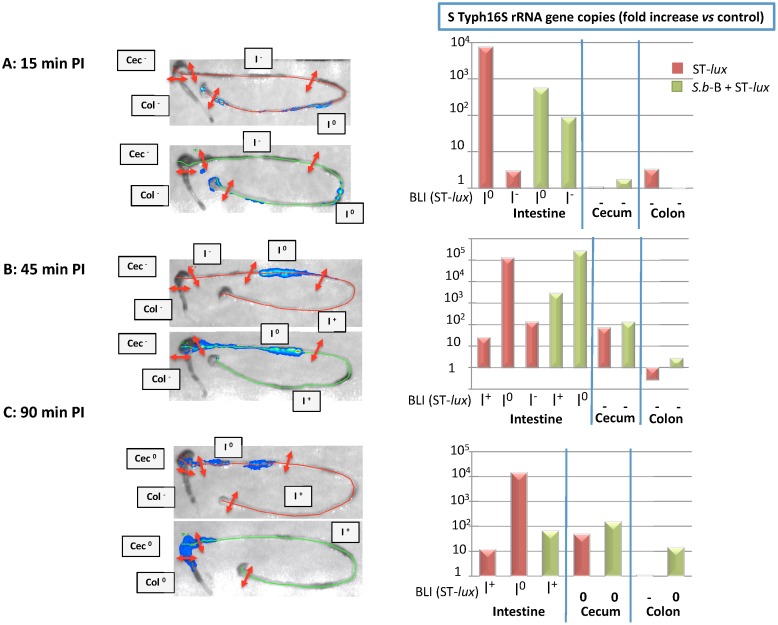
Figure 2. In vivo imaging of intestinal tracts extracted (A) 15 min PI, (B) 45 min PI, and (C) 90 min PI for mice infected with ST-lux alone (upper image, red line) and mice given both S.b-B and ST-lux (lower image, green line).
The green and red lines were traced manually. Left panel: Sampling of the gut after the mice were imaged at various times PI (see Figure S2 for details). Right panel: Quantification of ST 16S rRNA gene copies by real-time PCR for each sample of GIT. Data are representative of 5 independent experiments.

