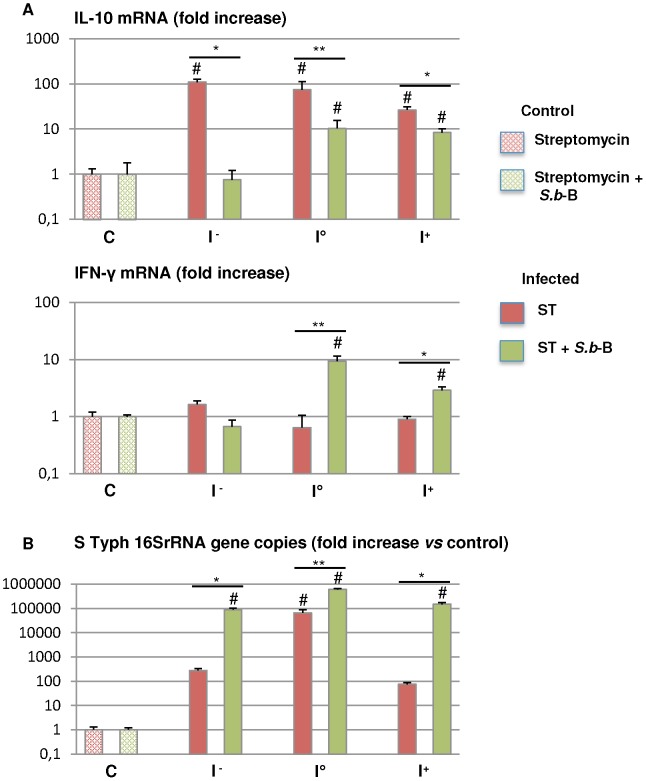
Figure 5. Cytokine expression measured by real-time PCR in the intestine of mice infected by ST-lux alone and mice challenged with S.b-B (A).
Following BLI measurement, small intestine samples were obtained: I− without photon emission, I° maximal photon emission, I+ after bacterial passage (see Fig S2 for more details). Data are presented as relative mRNA (fold change ×102). The number of ST 16SrRNA gene copies in each sample is shown in (B). N = 5, # p<0.05 treated animals vs controls, *<0.05 ST alone vs ST+ S.b-B, **<0.02 ST alone vs ST+ S.b-B.

