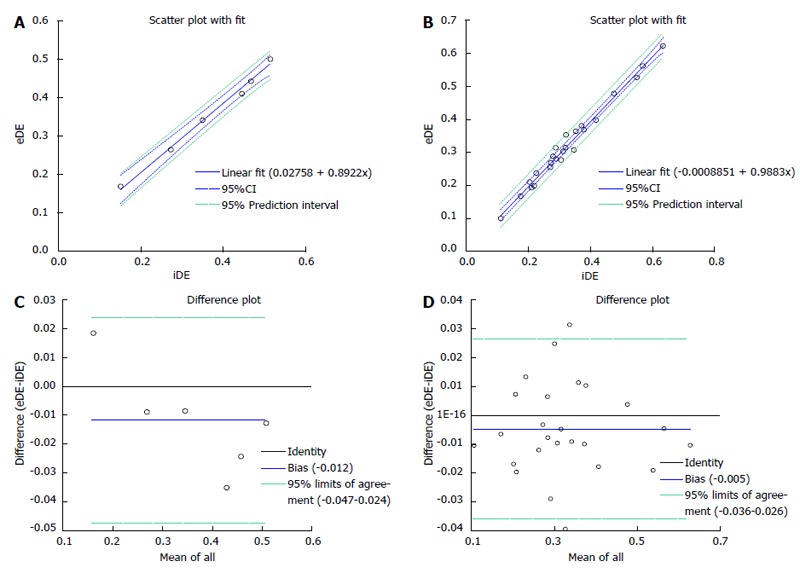
Figure 5.

The linear correlation (above) and Bland-Altman analyses (bottom) plots comparing the myocardial infarction on in vivo and ex vivo delayed enhancement magnetic resonance imaging. The plots graph displayed a good correlation between MI measured with in vivo delayed enhancement (iDE) and ex vivo delayed enhancement (eDE) on global (A) and slices (B). Plots of differences in myocardial infarction on global (C) and slices (D) were indicative of high agreement between iDE and eDE.
