Figure 1.

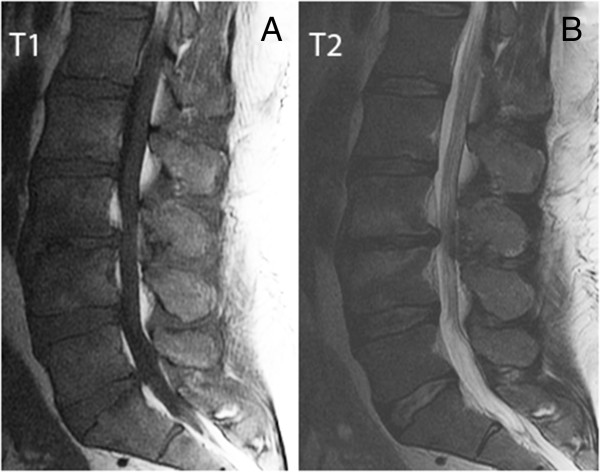
Comparison of the sacral area on T1 and T2 sagittal images. (A) The T1 on the left shows the thecal sac is partially obscured by EL. (B) The T2 sagittal MR image on the right shows a clear outline of the thecal sac ending at mid S2.

Comparison of the sacral area on T1 and T2 sagittal images. (A) The T1 on the left shows the thecal sac is partially obscured by EL. (B) The T2 sagittal MR image on the right shows a clear outline of the thecal sac ending at mid S2.