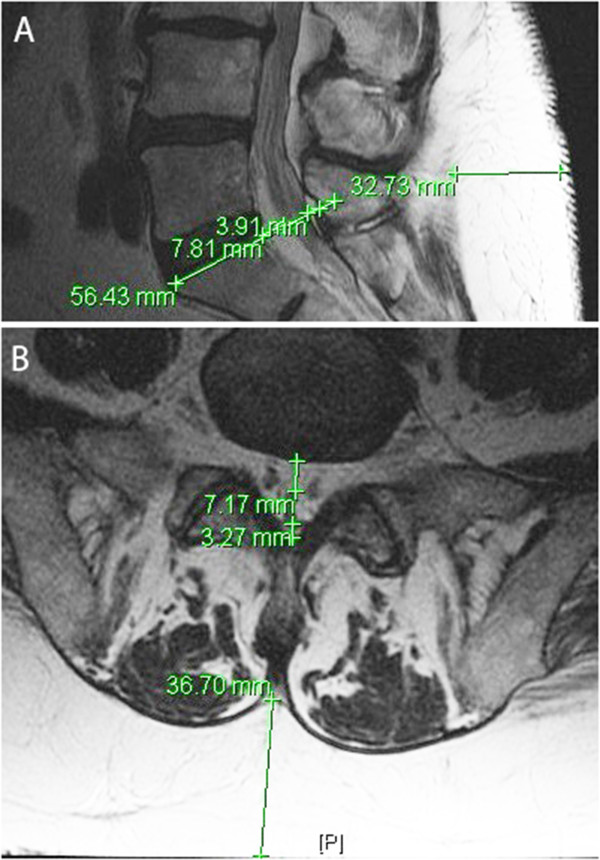
Figure 3.

Comparison of sagittal and axial images. (A) Sagittal T1 showing epidural fat measurements along a line tangent to the superior cortex of S1, anterior (7.8 mm) and posterior (3.9 mm). The thickness of posterior subcutaneous fat was measured horizontal to the L4/L5 interspace, line labeled 32.7 mm. (B) Axial image showing measurement discrepancy: anterior epidural fat is 7.2 mm, posterior epidural fat is 3.3 mm, and posterior subcutaneous fat is at least 36.7 mm.
