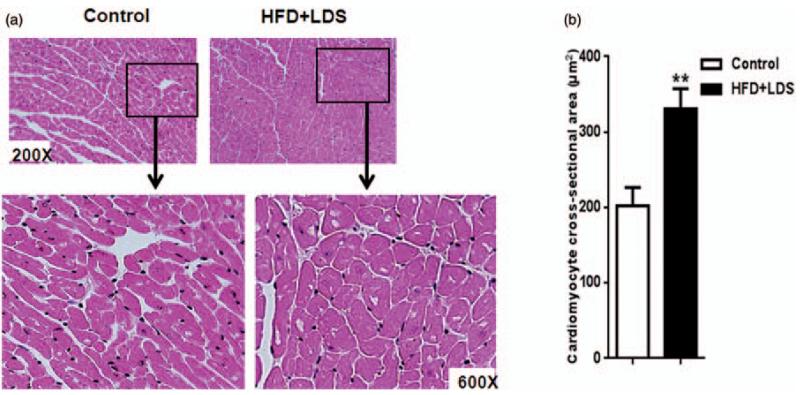
Figure 4.
Increase in cardiomyocyte hypertrophy in mice receiving a high-fat diet and low-dose streptozotocin. (a) Micrographs of cardiac sections: representative photomicrographs of hematoxylin-eosin stained cardiac sections from control and HFD + LDS groups depicting cardiomyocyte size. The insets are magnified to distinguish the difference in cardiomyocyte size. (b) Quantification data of cardiomyocyte cross-sectional area from control and HFD + LDS groups: At least 10 relatively circular cardiomyocytes with the nucleus in the center were included for quantification of each high power field. We scored at least 15 photomicrographs for each sample (n = 5–8; **P < 0.01). (A color version of this figure is available in the online journal.)

