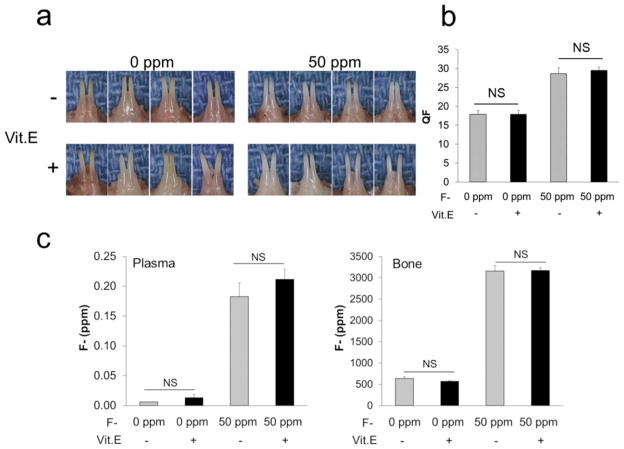
Figure 2.
Effect of vitamin E on dental fluorosis. (A) Images of mouse mandibular incisors provided drinking water containing 0 ppm (left panel) or 50 ppm (right panel) of F− for 6 weeks with control diet (upper panel) or vitamin E enriched diet (lower panel). (B) QF analysis of enamel as a function of F− treatment and vitamin E diet. (C) The concentration of F− in mouse plasma and bone was quantified. Assays were performed using four mice per group. Data are expressed as mean ± SE. (NS; not significant).

