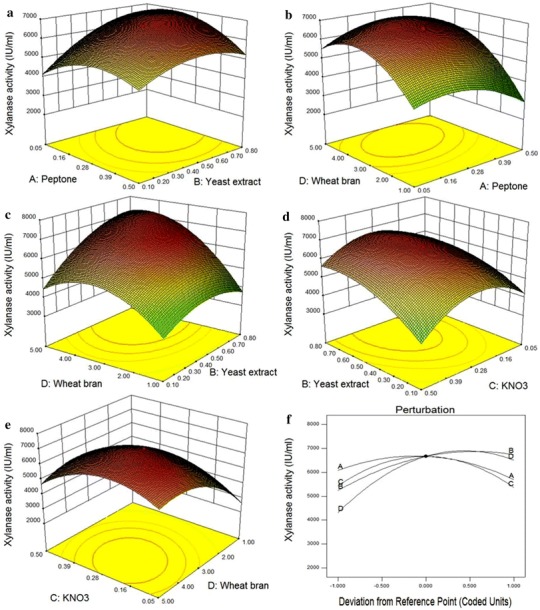
Fig. 3.

Response surface curves (3D/contour plots) showing interactions between a peptone and yeast extract; b wheat bran and yeast extract; c KNO3 and wheat bran; d peptone and wheat bran and e KNO3 and yeast extract and f is the perturbation plot showing simultaneous interaction of all the four factors on xylanase activity
