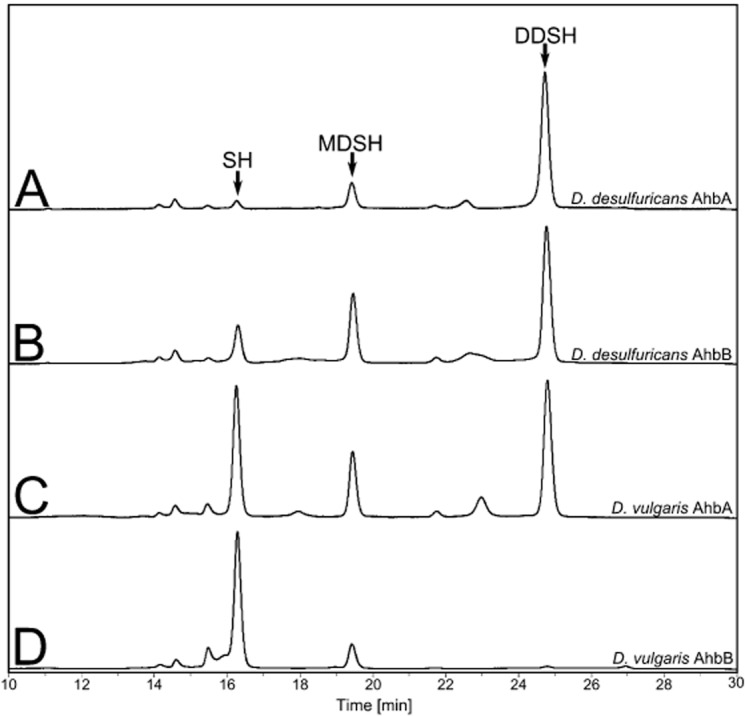
Fig. 2.

Reaction profile of sirohaem decarboxylases. HPLC traces, recorded at a wavelength of 380 nm, after incubation of sirohaem with excess purified (A) D. desulfuricans AhbA, (B) D. desulfuricans AhbB, (C) D. vulgaris AhbA, and (D) D. vulgaris AhbB. The arrows indicate the peaks relating to sirohaem (SH, ∼ 16 min), monodecarboxysirohaem (MDSH, ∼ 19.5 min) and didecarboxysirohaem (DDSH, ∼ 25 min).
