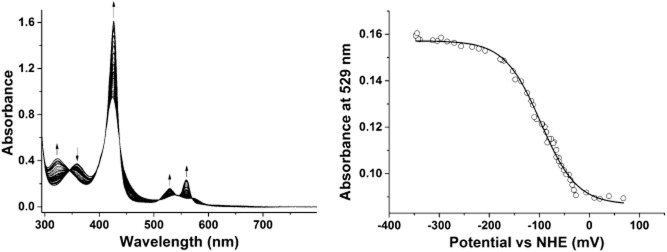
Fig. 5.

Redox titration of M. barkeri AhbA/B complex.A. UV-Vis spectra recorded during the redox titration. The arrows show directional changes of peaks as a reductive titration progresses.B. Plot of absorbance at 529 nm against redox potential versus normal hydrogen electrode (NHE). The redox potential for the Fe3+/Fe2+ couple of the bound haem iron is −98 ± 3 mV.
