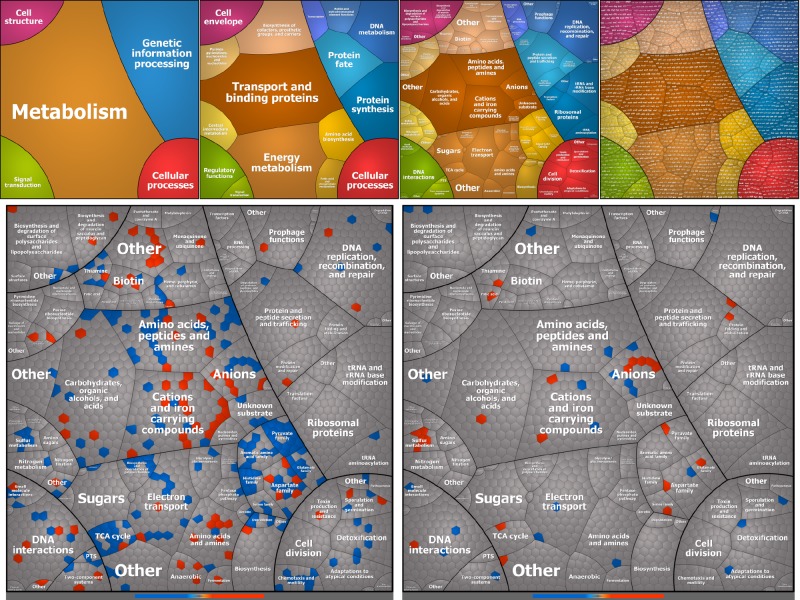
FIG 2 .
Tree map of differentially expressed genes in ExPEC O78-9 based on transcriptome analysis. Functional Voronoi tree maps of E. coli strain O78-9 were obtained from transcriptomes of bacteria exposed to serum for 15 min. Each cell represents one quantified transcript, and transcripts encoding functionally related proteins are subsumed in convex-shaped parental categories of increasing levels based on TIGR gene classification. The ratios of expression data were color coded by using a divergent color gradient. The bluish and orange tiles represent down- and upregulated pathways, respectively. Top panel: General representation of all functional pathways, levels 1 to 4 (left to right). Lower panel, left side: Transcription patterns in response to nutritional challenge. Lower panel, right side: Immune complement-induced gene fraction.

