FIG 2 .
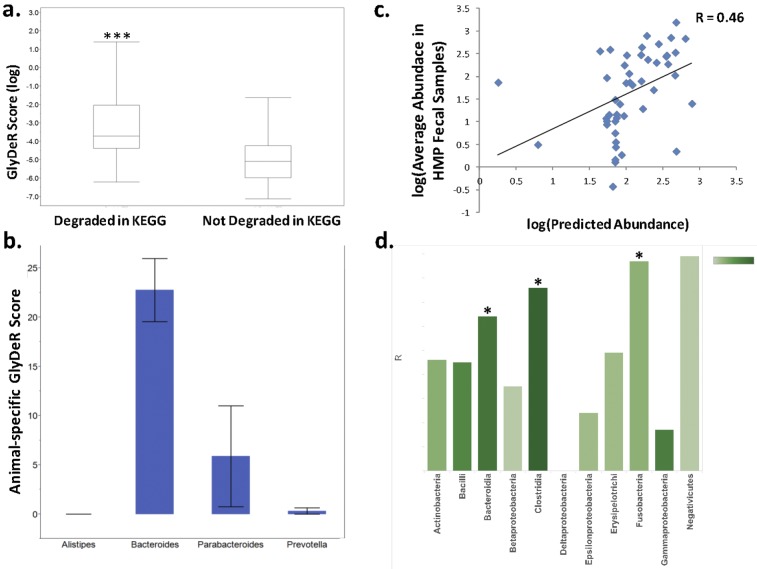
Glycan degradation of gut microbiota reference genomes. (a) Distribution of species-specific GlyDeR scores (y axis) for all the glycans in KEGG. GlyDeR scores with corresponding reactions in KEGG appear on the left, while those with no KEGG reaction appear on the right (Student’s t = 6.14, P < 0.0001). (b) Bar plot comparing the animal-specific glycan degradation potential of different bacterial genera within the Bacteroidetes phylum. Each bar depicts the sum of GlyDeR scores of organisms belonging to their respected phylum. The height of the bar represents the mean, while the error bars reflect standard errors. (c) The log-log scatterplot shows the average abundance of 48 HMP strains within 325 human fecal samples (y axis) and the linear regression-predicted abundance of each individual strain (x axis) (linear regression correlation coefficient = 0.46, P = 0.0016). (d) Bar chart denoting the correlation value (height of the bar) between actual and predicted abundance from linear regression models built for each class of bacteria (x axis) based on the taxon’s GlyDeR features. The color of the bar reflects the number of species in the class. The feature extraction is explained in Materials and Methods.

