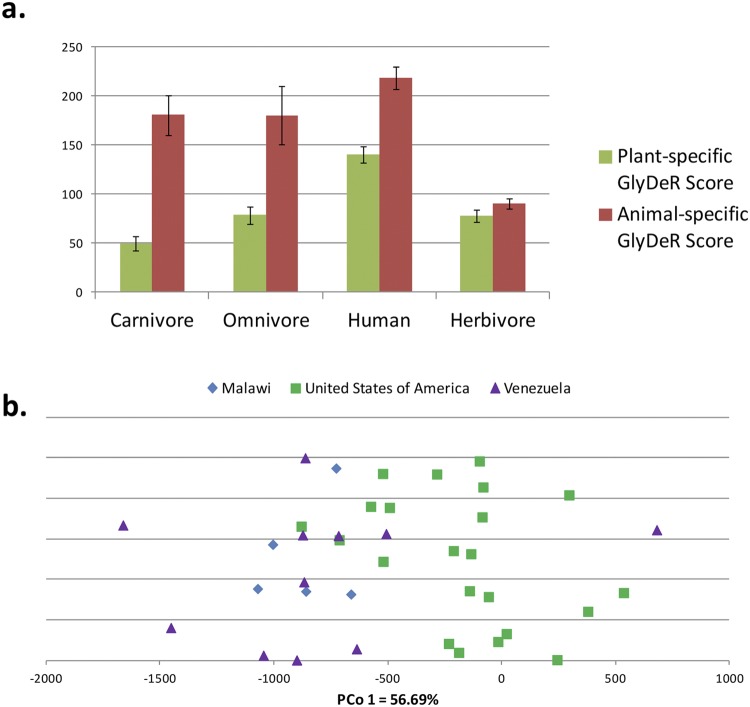
FIG 3 .
The connection between glycan degradation and diet. (a) GlyDeR profiling analysis of the Muegge data set. Bars showing the average sum of plant-specific and animal-specific GlyDeR scores of the samples grouped according to their host diet and normalized by the number of CAZymes in each sample. A fourth group was created to segregate humans from all other omnivores. The plant- and animal-specific GlyDeR scores of herbivores and carnivores are significantly different (P = 0.04 and P = 0.0001, respectively). (b) The Yatsunenko data set. A scatterplot showing the sample projections on the first principal coordinate and colored according to the country of origin. Samples from individuals younger than 2 years old were omitted (see text).

