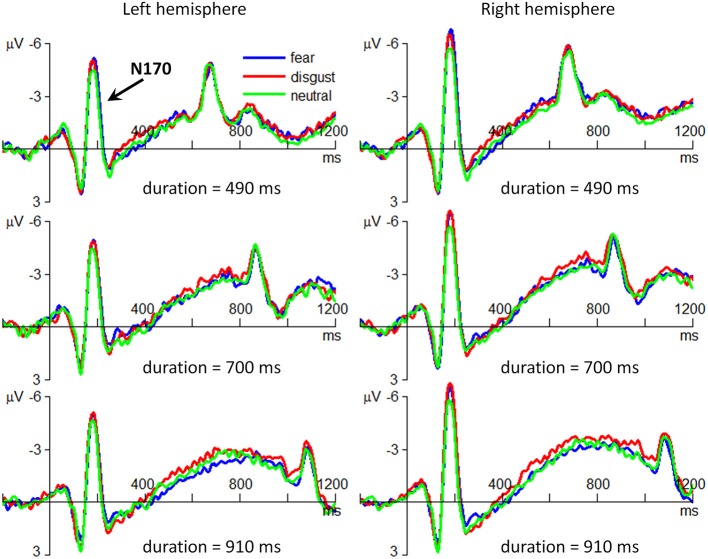
Figure 4.
The grand-mean ERP waveforms of the N170 component. The three plots in the left column are drawn using the data at the electrode site of P7; the three plots in the right column are drawn using the data at P8. For the sake of brevity, only the ERPs in the three conditions of stimulus duration (490/700/910 ms) are displayed.

