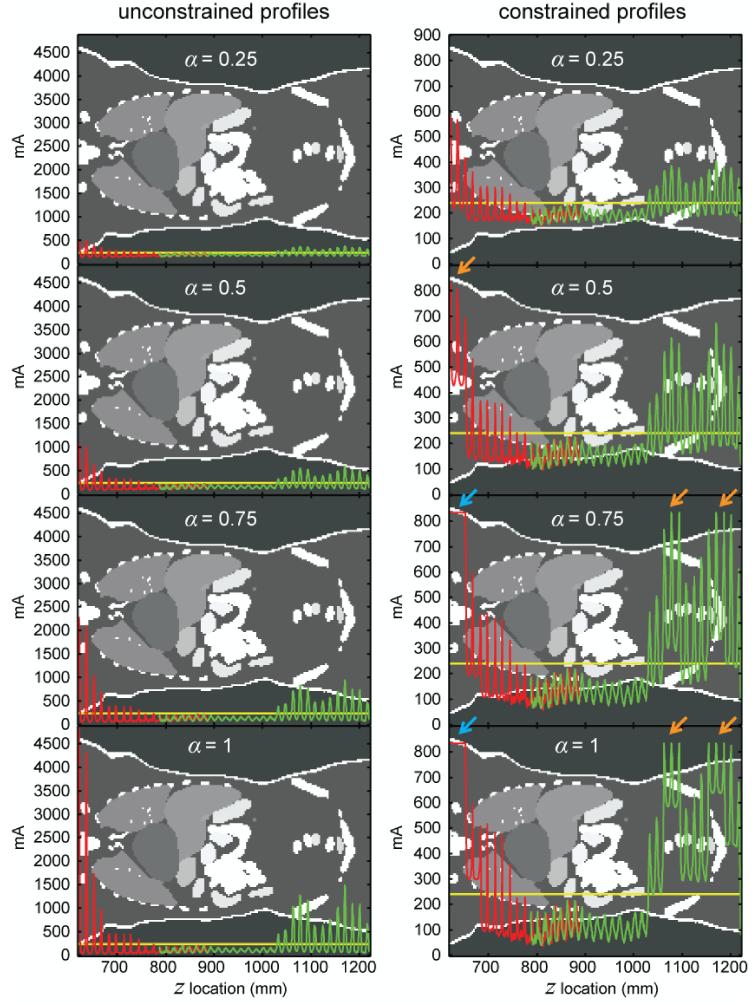
Figure 4.
Theoretical tube current (mA) modulation profiles generated for the XCAT female reference phantom under unconstrained and constrained conditions for chest (red) and abdomen-pelvis (green) CT scans. The two scans had an overlap of around 10 cm (z locations between 787 mm and 890 mm). At each z location in the overlapped region, the gantry angle (tube position) was different for the two scans, resulting in a difference in calculated attenuation (Aθ) and a corresponding mA difference. α controls the strength of the modulation as defined in Equation 3. The horizontal (yellow) line in each figure (240 mA) corresponds to the reference mA of the two scans. It also represents the constant tube current when α=0. At locations where the unconstrained mA profiles exceeded the system limit, the corresponding constrained mA profiles had a reduced modulation amplitude (orange arrows) or zero modulation amplitude (blue arrows). The grayscale image in the background is a single coronal plane taken about half-way in between the anterior and posterior surfaces of the phantom. The grayscale values in the image represent arbitrary organ tags.

