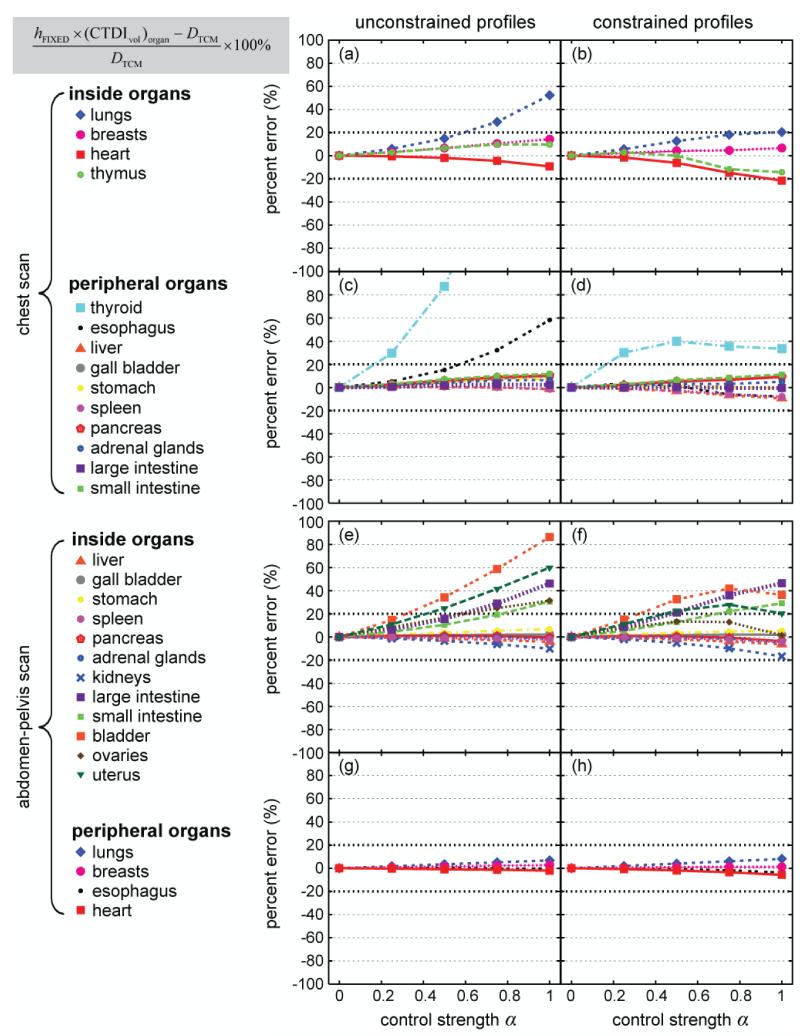
Figure 8.
Discrepancy between hFIXED × (CTDIvol)organ and DTCM as a function of modulation control strength α. Data points are connected by lines for easy visualization. All data points are plotted over the same y range of [−100%, 100%] to allow the trends of the data to be better visualized. The data points cut off by the upper boarders of the plots represent percent errors greater than 100%.

