
Figure 5.
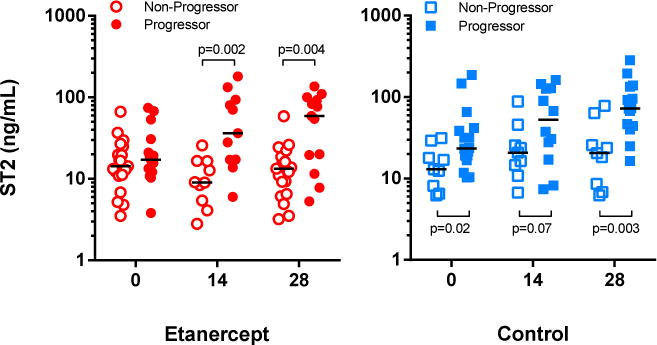
Patients whose acute GVHD progressed to grade 2–4 had higher plasma ST2 levels than patients whose GVHD did not progress. Plasma ST2 concentrations at the time of grade 1 diagnosis and treatment onset (day 0), day 14 and day 28 in patients whose GVHD remained grade 1 or resolved with treatment (Non-Progressor) and patients whose GVHD progressed to grade 2–4 (Progressor) at any time after diagnosis. (left) Study patients. Non-Progressors with samples available for analysis: day 0, n=19; day 14, n=10; day 28, n=19. Progressors: day 0, n=15; day 14, n=11; day 28, n=13. (right) Contemporaneous control patients. Non-Progressors with samples available for analysis: day 0, n=9; day 14, n=9; day 28, n=9. Progressors: day 0, n=17; day 14, n=12; day 28, n=14. Each plotted point represents a single patient. Horizontal black lines represent median ST2 concentrations plotted on a logarithmic-scale (Log10) y-axis.