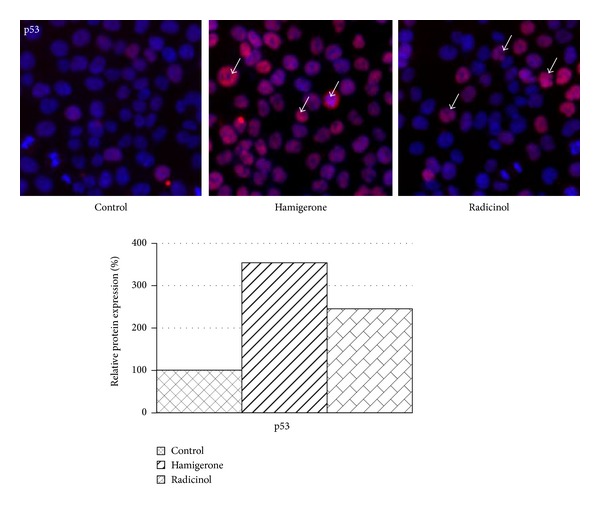
Figure 3.

Elevation of p53 expression on treatment with hamigerone and radicinol in Panc-1 cells. The nucleus was stained with Hoechst 3342 (blue color), the expression of p53 protein levels was detected using Dylight 549 (red color), and the represented images are composite images of both channels. The quantitative data of p53 expression against untreated control cells is denoted as bar diagram. 1000 cells were counted for each replicate well and the results were presented as an average ± SE.
