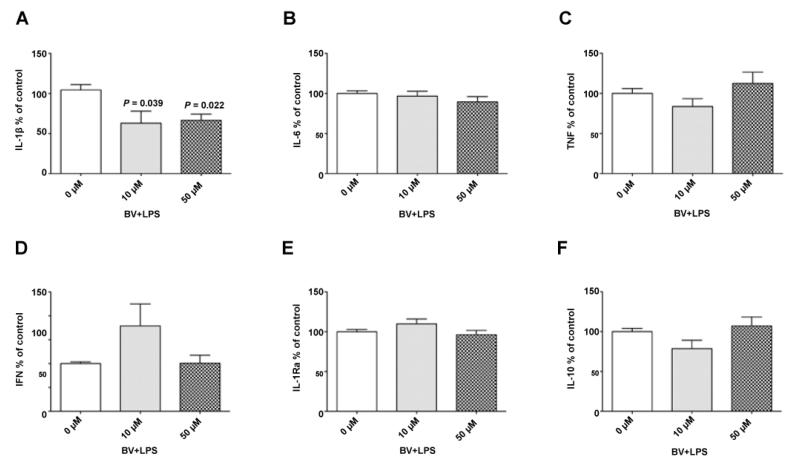
Figure 2. Cytokine concentration in response to LPS and BV.
Whole blood was incubated with BV and LPS for 8 h and cytokine concentration was measured using a Milliplex human cytokine kit. The relative change in each cytokine (A-F) concentration is presented. Data are presented as mean ± S.E. n=7, P<0.05 vs. sample treated with LPS only (0 μM).

