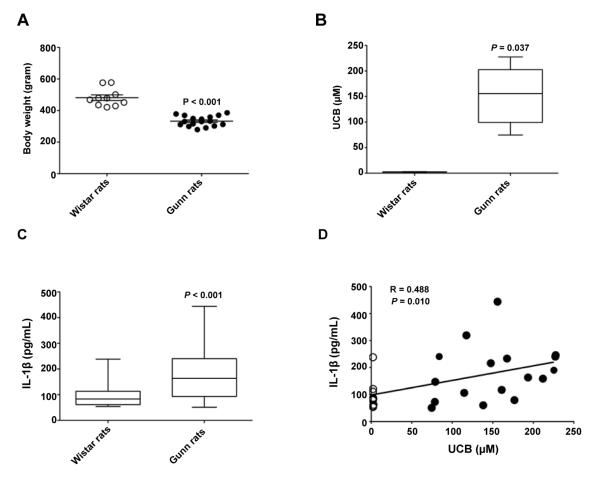
Figure 5. IL-1β concentration in blood samples of wild type control and Gunn rats.
(A) Graph showing the body weight of Wistar (n=10) and Gunn rats (n=17). Data are presented as mean ± S.E; P<0.05 vs control (non-jaundiced Wister rats). Box plot showing the serum UCB concentration (B) and IL-1β concentration in Wistar and Gunn rats. (C) Data are presented as median (25-75% interquartile range); n=10 for Wister and n =17 for Gunn rats and P<0.05 vs. control (non-jaundiced Wister rats). (D) Scatter plot and the correlation between baseline UCB concentration and IL-1β concentration; n=10 for Wister and n =17 for Gunn rats.

