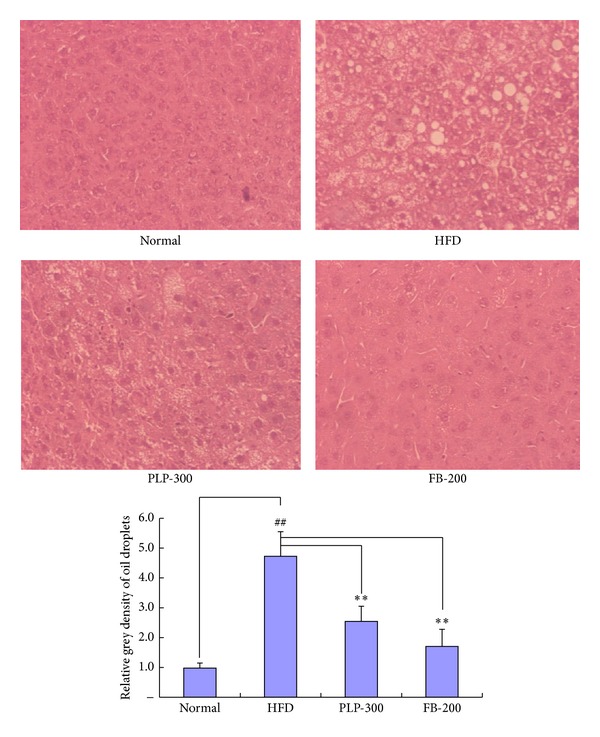
Figure 3.

H&E staining images from liver sections of mice (200x). Normal: normal control mice; HFD: high-fat diet-fed control mice; PLP-300: pineapple leaf phenol-treated (300 mg/kg) HFD mice; and FB-200: fenofibrate-treated (200 mg/kg) HFD mice (n = 5). ## P < 0.01 versus normal controls and ∗∗P < 0.01 versus HFD controls.
