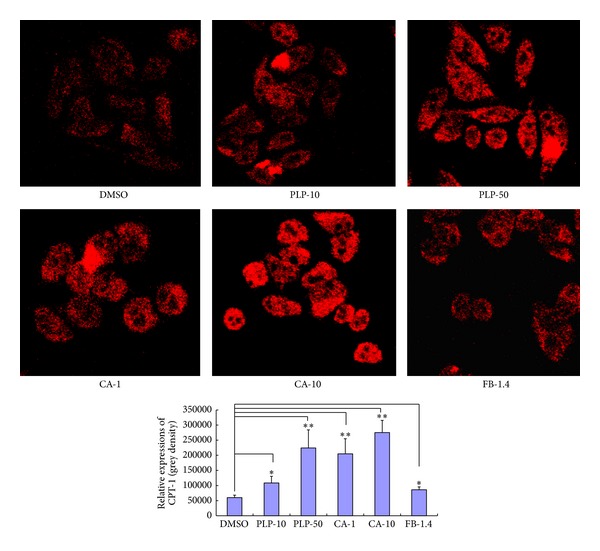
Figure 7.

Effect of PLP and CA on CPT-1A expression in HepG2 cells based on the immunofluorescence assay using confocal microscopy. DMSO: DMSO-treated control cells; PLP-10, PLP-50: pineapple leaf phenol-treated (final concentrations of 10 and 50 μg/mL, resp.) cells; CA-1 and CA-10: coumaric acid-treated (final concentrations of 1 and 10 μg/mL, resp.) cells; and FB-1.4: fenofibrate-treated (final concentration of 1.4 μg/mL) cells. Data are expressed as mean ± SD (n = 3). ∗P < 0.05, ∗∗P < 0.01 versus DMSO controls.
