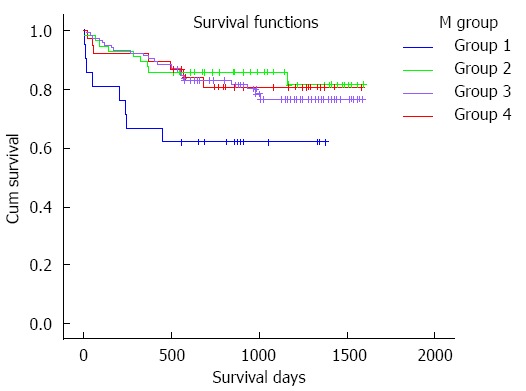
Figure 1.

Patient survival curve according to the mean tacrolimus concentration. The survival time of group 1 is obviously shorter than other groups (group 1 vs group 2, 911.3 ± 131.6 d vs 1381.1 ± 66.1 d, P = 0.018; group 1 vs group 3, 911.3 ± 131.6 d vs 1327.3 ± 47.8 d, P = 0.024; group 1 vs group 4, 911.3 ± 131.6 d vs 1343.2 ± 83.1 d, P = 0.067) while the rates in groups 2, 3 and 4 are almost the same (group 2 vs group 3, 1381.1 ± 66.1 d vs 1327.3 ± 47.8 d, P = 0.501; group 2 vs group 4, 1381.1 ± 66.1 d vs 1343.2 ± 83.1 d, P = 0.774; group 3 vs group 4, 1327.3 ± 47.8 d vs 1343.2 ± 83.1 d, P = 0.801). Group 1: Mean tacrolimus concentration is 0-5 ng/mL, Group 2: 5-7 ng/mL, Group 3: 7-10 ng/mL, and Group 4: 10-15 ng/mL.
