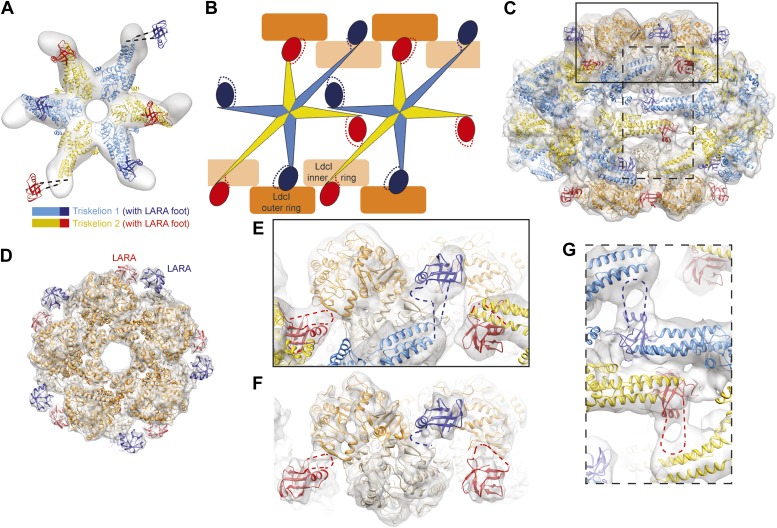
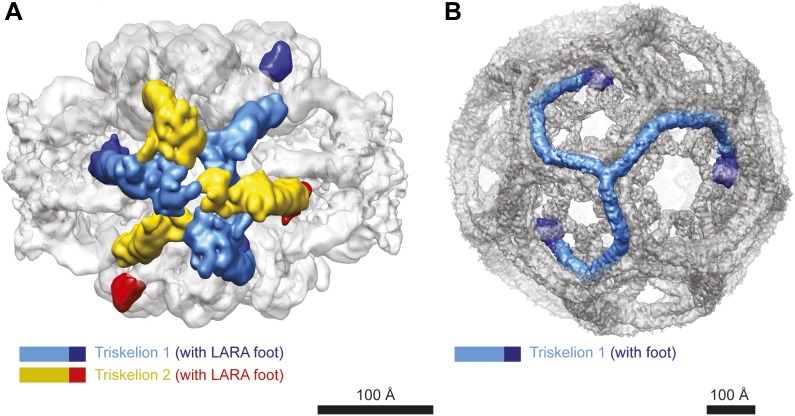
Figure 2. The structural organization of the LdcI–RavA cage.
(A) The RavA hexamer is represented as two triskelia. The pseudoatomic model of the RavA hexamer in the context of the LdcI–RavA complex is superimposed with the isolated RavA negative stain EM map (25 Å resolution, El Bakkouri et al., 2010) to show the conformational changes of the RavA legs induced by LdcI binding. (B–G) The RavA loop at the beginning of the LARA domain (amino acids 329–360) is shown as a broken line. (B) Schematics of LdcI–RavA interaction with RavA. (C) CryoEM map and pseudoatomic model of LdcI–RavA (11 Å resolution). This particular orientation of the complex illustrates the origins of the close-up views (E) and (G) surrounded with a solid rectangle and a broken line rectangle, respectively. (D) Top view of the cryoEM map and pseudoatomic model of the LdcI-LARA complex (7.5 Å resolution). (E) Close-up view of the LdcI–RavA complex (11 Å resolution) showing the LdcI-LARA interaction and arising from the bold rectangle in (C). (F) Close-up view of LdcI-LARA (7.5 Å resolution) in the same orientation as in (E). The higher resolution of this 3D reconstruction enables a more precise fitting of individual crystal structures. (G) Close-up view of the equatorial RavA–RavA interaction via the triple helical bundles and the foot–leg interaction (arising from the broken line rectangle in (C)).

